What Causes Airport Delays?
Objective: To analyze airport data to understand the cause of airport delays using Principal Component Analysis.
The first step was to load the airport data from three .csv files that included airport information, cancellation counts, and delay details. After merging the data to one data frame and dropping any rows with missing airport info, 799 rows remain. I selected a few key features and ran a pairplot to see any initial correlations.

The below graph shows the mean on-time gate arrival percent for each FAA region from 2004-2014. Most FAA regions remain pretty constant with ANM
consistently the highest on-time percent. AEA remained at the lowest on-time percent for this period. AAL is the only region to show an
improvement – and a dramatic one at that. In 2004, this region’s OT% was 0.65 (with the next lowest at 0.73), and in 2014 increased their OT%
to the highest of all regions to 0.86 (with the second best at 0.81).

The below graph simply shows FAA region by size (number of departures). It’s important to note that the largest region, ANM, had the consistently
highest OT% over the 10 year span.

Before getting to Principal Component Analysis, I ran the clustering methods on the data as-is to get a baseline.
K-Means Clustering After scaling the data using the StandardScarler in sklearn, I ran a k-means clustering and measured with a silhouette score. We need to determine the number of clusters, k, so we can fit the model a few times until we find the maximum silhouette score which happens to be 0.290 with a k value equal to 5. Code below:

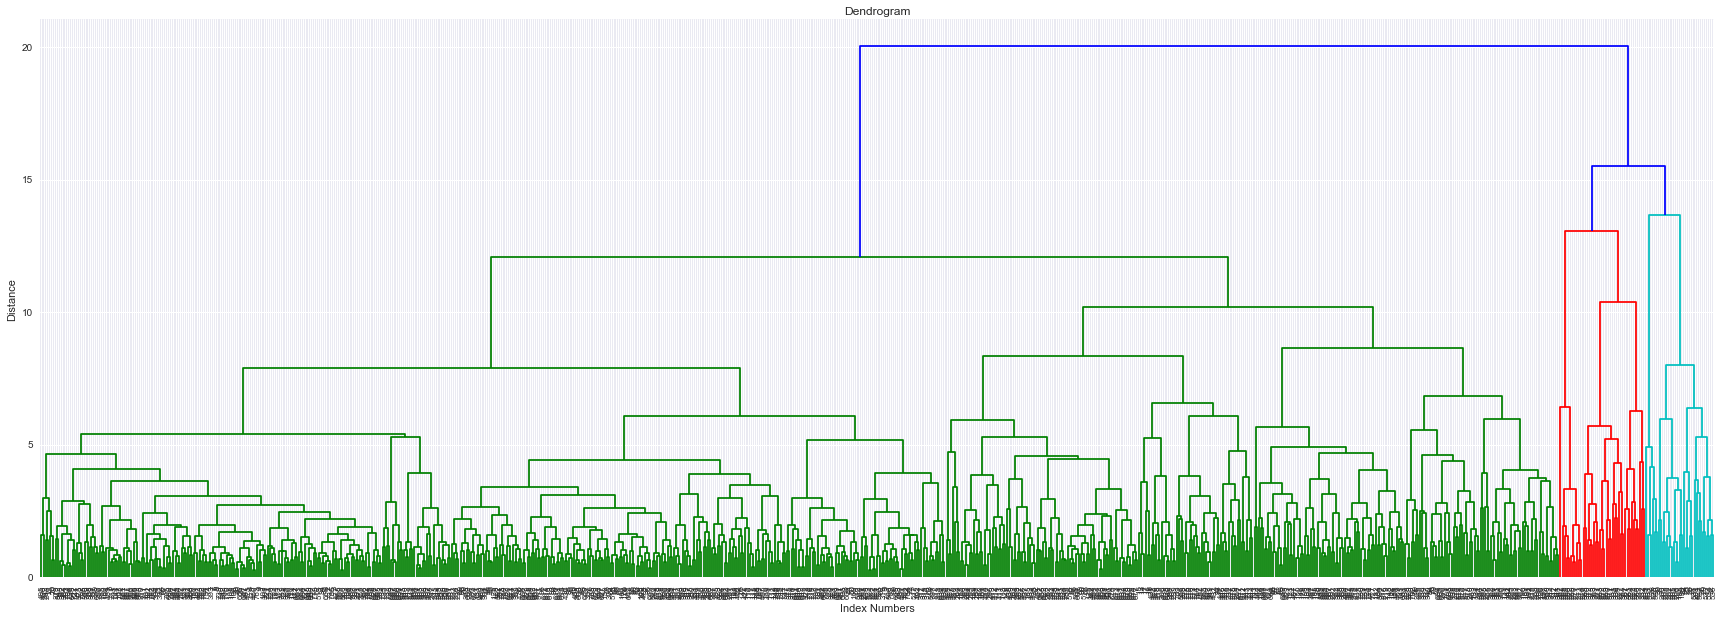
Hierarchical Clustering The second clustering method I chose was Hierarchical which I ran with the code below. The cophenetic correlation coefficient, c, compares the pairwise distances to those implied by the hierarchical clustering. The c, in this case, is 0.782 with a maximum value of 1. The silhouette score was also calculated to be: 0.539. Code below:

The resultant dendrogram is below:

PCA The next step is PCA. First, I found the covariance matrix and with that was able to find EigenValues and EigenVectors. The explained variance was then calculated by dividing each EigenValue by the sum of all the EigenValues. By sorting and finding the cumulative sum, you can verify the variance explained by the number of components. In this case, using three principal components, 86% of the variance is explained. The new components were then plotted on a 3D plot.

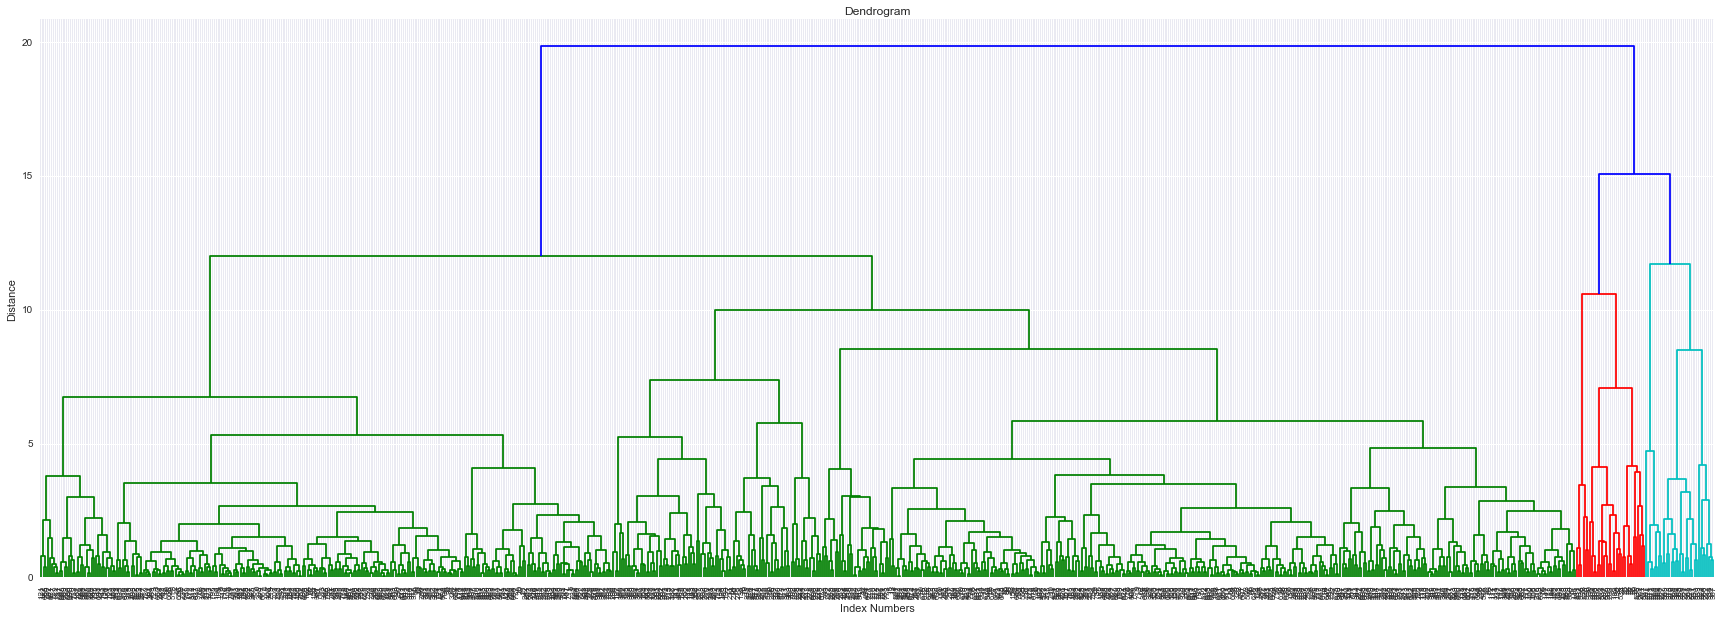
To see the effects of PCA, I ran the K-Means and Hierarchical clustering again with the new principal components. The silhouette scores were 0.315 and 0.566, respectively which shows an improvement. Below is the dendrogram post PCA.

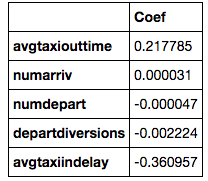
Logistic Regression I also ran a logistic regression on the clustered data to be able to determine which features are most correlated with delays. I created a binary feature of the avg gate arrival delay was less than or greater than the median delay. After running the logistic regression, the single largest contributor to delays is avg taxi out time. The accuracy score for this model was 0.872.

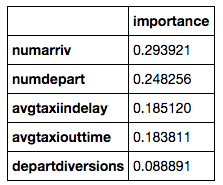
Random Forest Finally, I ran a random forest classifier with the same data as above to see if there were any differences. The most important features were size of airport (number of departures and arrivals) and also taxi time which is consistent with above. The accuracy score for this model 0.941.

Recommendations First, take a closer look at the AAL region to determine what additional conditions were present that caused the dramatic increase in on-time percentage. Secondly, ANM, for being the region with the most departures, had the highest consistent OT%. What conditions were present here to maintain that rate? On the same token, AEA had consistently the lowest OT%. Attention should be focused in this region first. Finally, taxi delays seem to be the largest contributors to overall delays without respect to airport size. A deeper investigation should be conducted into root causes and what can be done to minimize delay here.