Billboard Data - Year 2000
Objective: To review track information for the top songs from the year 2000 to identify correlations in top performing songs.
Upon looking at Billboard data in the year 2000, the first thing I wanted to know was how the top songs for the year are determined.
Before we can get to that though, I had to clean some of the data to a usable form – namely turning the date into pd.datetime standard and turning the weeks in which the song was not on the chart into np.nan so these data can be understood.
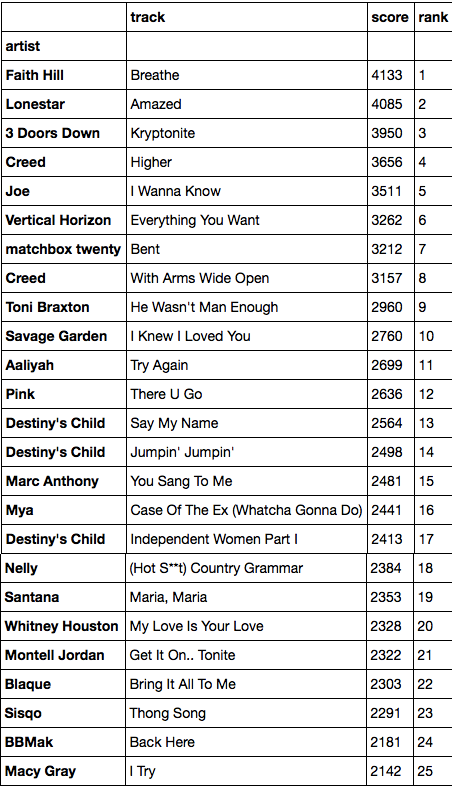
Turns out, Billboard used a scoring system where a song is given a set number of points based on its rank for each week that it is on the chart. 100 points is given to the top song of the week and 1 point to the 100th song. Knowing this, I found the top 25 songs of the year by adding a new column to the data frame (number of weeks on chart) and calculating each song’s score.
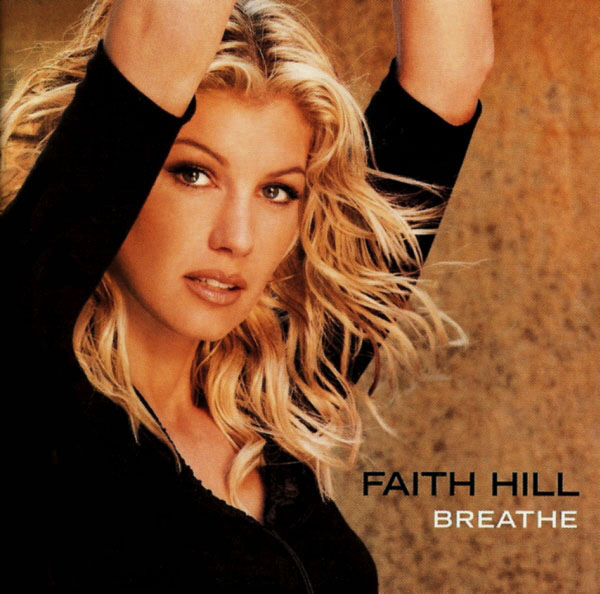
And the winner is…. Faith Hill with Breathe.
Here is a list of the top 25 songs of the year ranked by score.
The next thing that I wanted to know was what factors contribute most to a song’s score. Below you can see scatter plots of score against:
- Position the first week it entered the chart.
- The number of weeks it took for the song to peak.
- The percentage of time the track spent climbing to its peak relative to overall time spent on the chart.
- Final chart position.
- Weeks spent on chart.
- Week of calendar year that the song entered the chart.
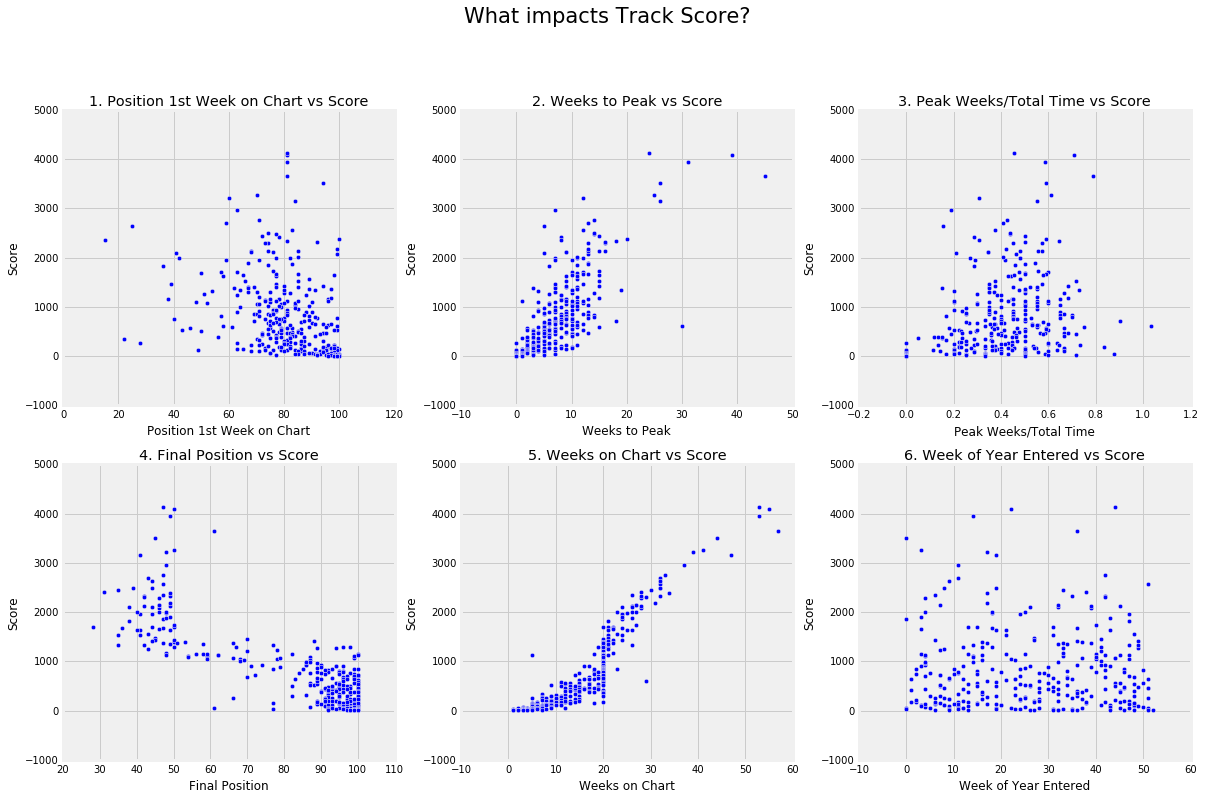
The interesting takeaways from each chart are:
- The songs that charted higher on their first week are not significantly more likely to reach a higher score.
- The songs that reached over 3000 points did not peak until their 25th week on the charts as opposed to hitting top 10 early and staying there.
- The highest scoring songs peaked 50-80% of the way through their time on the charts.
- Very Interesting - There is a clear cut off around 1000 points for songs with chart position worse than 50. I’ll talk about why later.
- This chart makes sense. The longer a song is on the chart, the more points it will earn.
- The is no clear relationship between score and the time of year that a song debuted. It may be worth noting that 6 of the 8 songs that 3000 points debuted in the first half of the year. This may be coincidental given the small sample size.
CODE:

Now, since weeks on chart is a major factor in a song’s score, let’s see if there is any relationship between the number of weeks spent on chart and these variables:
- The number of weeks it took for the song to peak.
- Final chart position.
- Position the first week it entered the chart.
- Week of calendar year that the song entered the chart.
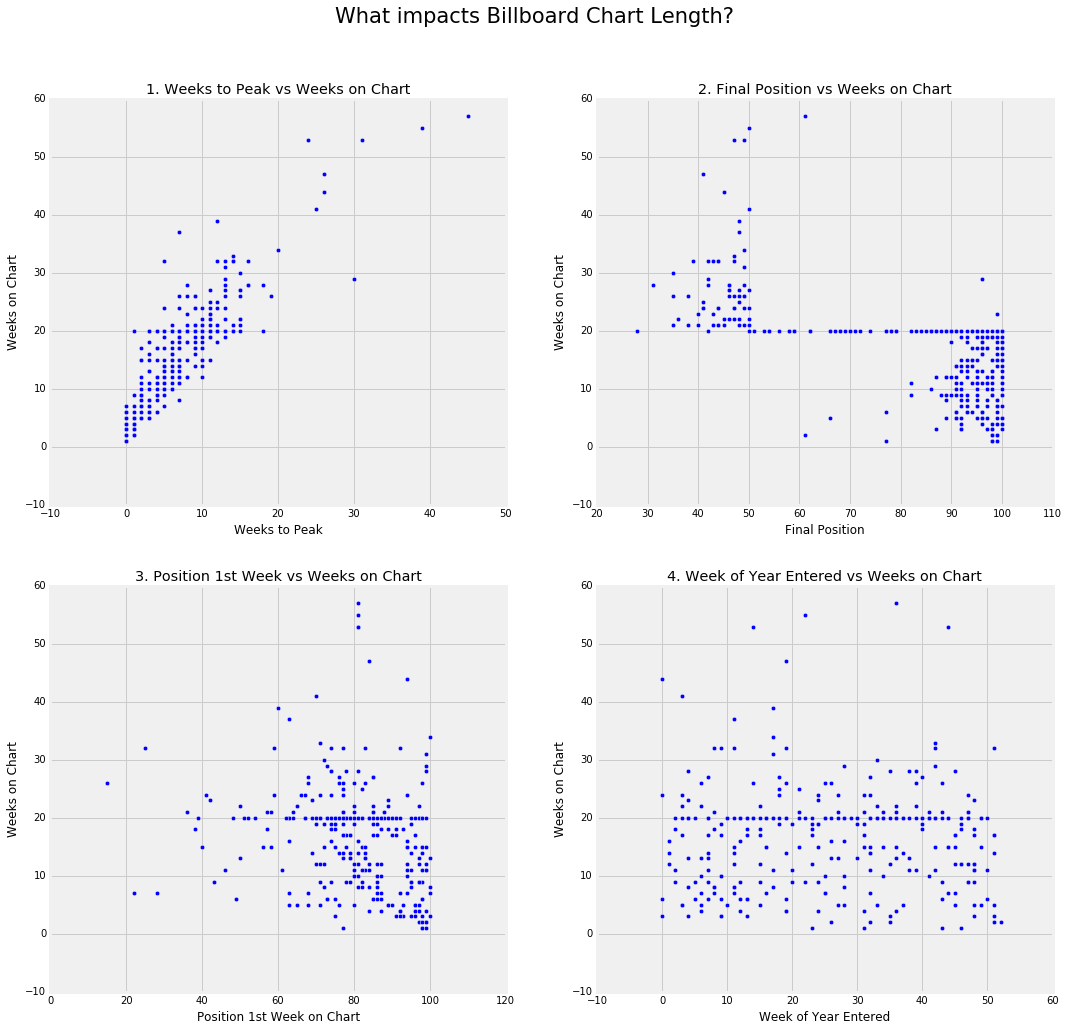
The interesting takeaways from these charts are:
- The longer that a song takes to peak, the longer it will be on the chart.
- Just about every song either spends less than 20 weeks and falls off the chart from a position between 80-100 or spend more than 20 weeks and end at a position between 30-50.
- There is no real relationship between number of weeks on chart and the position at which a song enters the charts. As seen on chart two, it is worth noting that there is a collection of songs that ended after 20 weeks on the chart.
- There is no real relationship between number of weeks on chart and the week in the calendar year in which it entered the charts. The same concentration of songs that ended on 20 weeks can be seen here as well.
CODE:

After researching this, it turns out that Billboard had a policy at that time to drop a song from the chart if it had already charted for 20 weeks and fell below position 50. This explains the high number of songs on the chart for exactly 50 weeks seen in graphs 3 and 4 and also the only songs with weeks longer than 20 had higher chart positions seen in graph 2.
Graph 4 in the first section shows a clear divide between songs finishing their chart run between positions 80-100 and songs ending between positions 30-50. This happens around 1000 points, and this now makes sense given the 20 week and rank 50 threshold.
Problem Statement
There is an inverse relationship between the time a song takes to reach its peak position once entering the chart and the total time a song stays on the chart. In other words, the faster a song reaches its peak position, the fewer total weeks it spends on the chart.
To begin thinking about this, I considered the following:
- What is the best way to represent a song’s ascent? Should this be as the ratio of time spent climbing to the total time spent on the chart? To get this data, I will need to calculate the following: weeks a song was on the chart by counting the weeks not equal to np.nan, the weeks spent climbing which equals the date entered subtracted from the date peaked, and the percent time to peak which is weeks spent climbing divided by weeks on chart.
- What is best way to graphically represent this? I would imagine a scatter plot so that many data points can be shown.
- What other variables may play a role in visualizing this data?
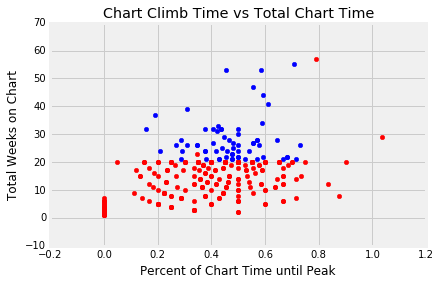
The graph above shows the percent of the time a song spent climbing on the chart relative to the total time it spent ont the chart. The blue and red points represent songs whose final position was better and worse than 50, respectively. I hypothesized that the faster a song reached its peak, the fewer total weeks it would spend on the chart. There does appear to be a very slight quadratic relationshiph between these variables with the minimum value at 0.50. The stronger relationship is clearly between final position and weeks on chart after 20 weeks.
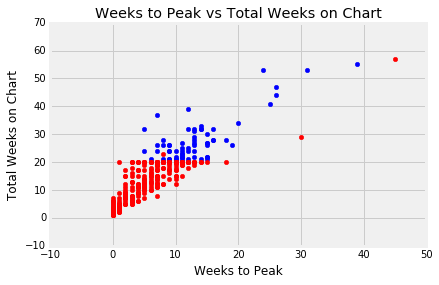
This graph shows the relationship between total weeks spent on the chart and the number of weeks the song spent climbing to its peak position. The blue and red points show the final position the song held being better or worse than 50, respectively. There is a linear relationship between the number of weeks before a song peaked and the total number of weeks it spent on the chart. Again, we are also able to see the strong influence chart position after 20 weeks plays on a songs length of time on the chart.
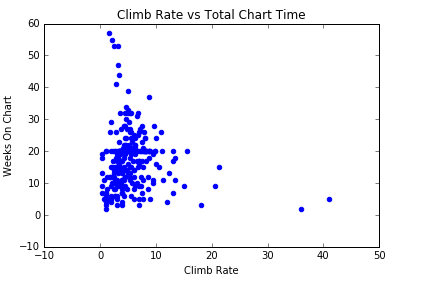
Contrary to my hypothesis, there is no clear relationship between the rate at which a song climbed to its peak position and the number of weeks that it spent on the chart. If anything a slight positive relationship exists meaning that the faster a song reached its peak position, the more weeks it would likely spend on the chart.
CODE:


