Predicting Salaries
Objective: To collect data science salary data from www.indeed.com and build a model to predict salary based on location, job title, and company information.
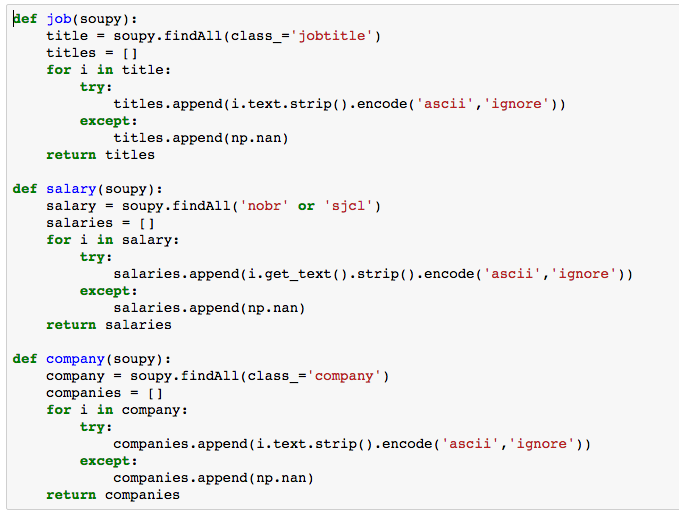
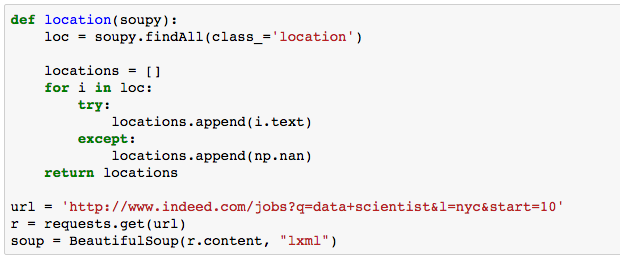
The first step was to scrape the data using BeautifulSoup. A total of 500 listings were taken from each of the five cities – Austin, Seattle, San Francisco, Chicago, and New York City. The web scraping functions used are below:
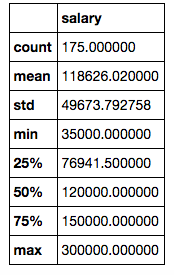
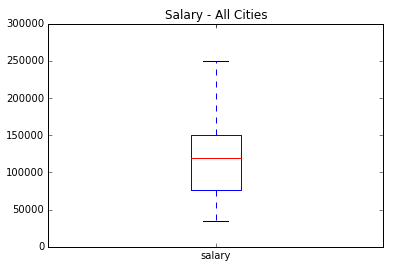
The data was obtained, cleaned, and duplicate postings were removed. If the salary was provided in a range, the mean was used. Here is a snapshot of the 175 unique postings that remained:
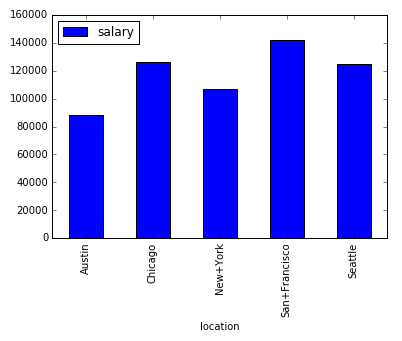
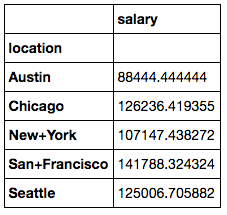
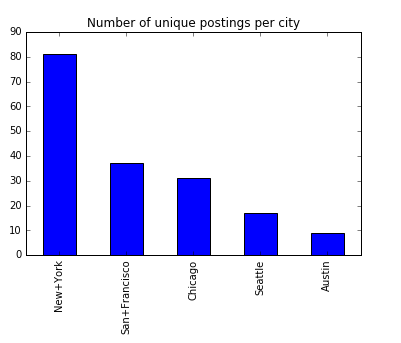
Broken down by city, below you can see the mean salary by city and the number of postings per city. You can see that according to indeed.com, the highest data science salaries are in San Francisco and Chicago, but the most number of job postings was in New York.
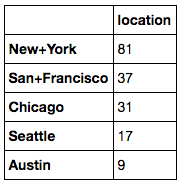
First, I created a True/False column called “SalaryHigh” in the dataframe to indicate of the salary given was above or below the median. I then ran a logistic regression with statsmodel.api using only location as a feature and the “SalaryHigh” column as the target data. Dummy variables were created as these are categorical variables. The summary is pictured below. You can see that of the cities listed, location was a stronger predictor of salary for Chicago and San Francisco as the p>|z| score was approximately 0.39. Salaries also happened to be highest in these cities as we saw earlier.

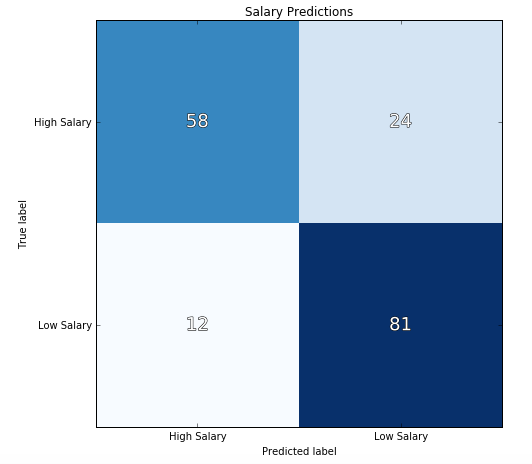
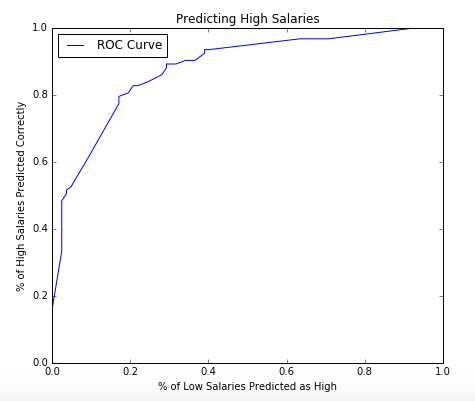
Next, I added job title information as a feature. The keywords (and their variants) used were “Manager”, “Director”, “VP”, “Chief”, “Analyst”, “Scientist”, and “Engineer”. An “Other” category was also used if none of the above applied. I ran a logistic regression using these features as well as location using scikit-learn. Below you can see the confusion matrix and ROC curve. The precision and recall were 77.1% and 87.1% respectively.

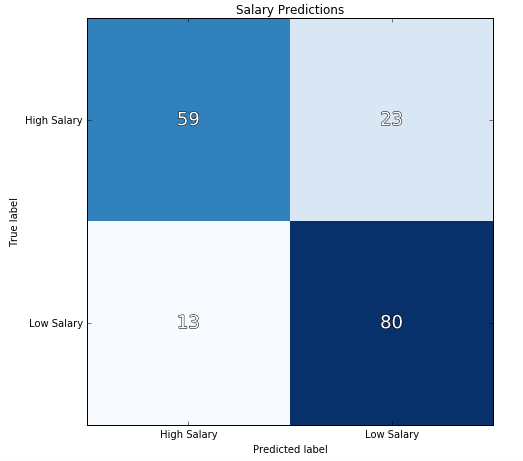
I then added keywords from the company as another feature. These keywords were “Corp”, “Analytics”, “University”, “Group”, “Software”, “Technology”, “Engineer.” Again, I used an other for everything else.
I ran the logistic regression again and the model was slightly changed for the worse. The precision and recall scores were 77.0% and 86.0%.
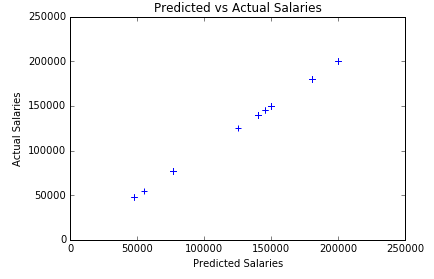
Finally, I used this model to predict the salaries for 100 postings for which I already had salaries. The predicted vs actual graph is below and is the exact shape we would want to see. The predicted and actual values align like y=x.
