Titanic Survivorship
Objective: To review and analyze data from the Titanic and model survivorship based on passanger details.
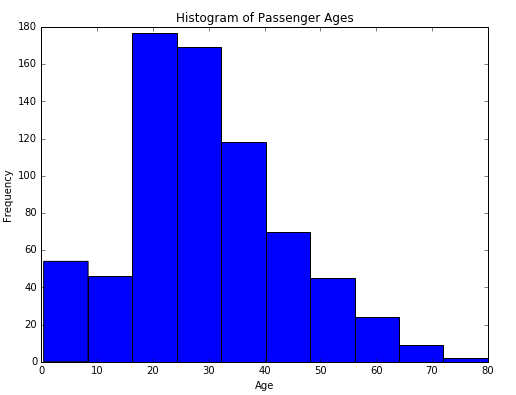
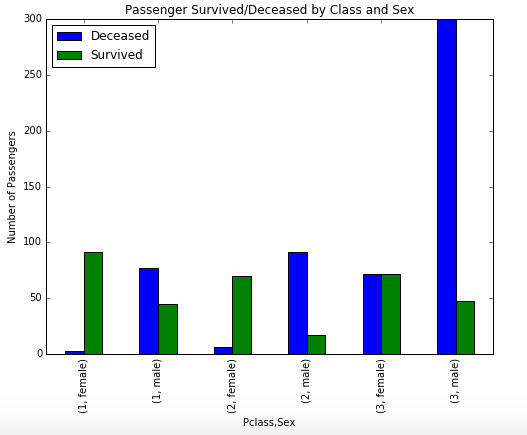
Taking a look at the data by age alone, we can see that the age skews younger with a median age of 28. If we add class and survivorship, it becomes very obvious that the largest number of deaths came from third class males. We also start to see that women stood a better chance of survival especially in the higher classes.
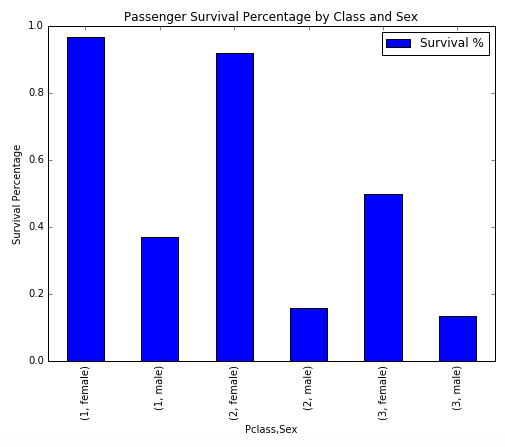
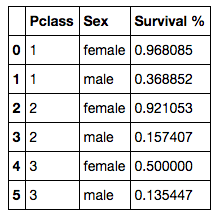
When we put the same information in terms of percentage of survivors, we get a good picture of who survived and the likelihood of survival in each class. Half of all women in third class survived, and more than 90% of women in second and first classes survived. Men, on the other hand, have survival rates in first, second, and third classes of 37%, 16%, and 14%, respectively.
Before we run a logistic regression, we’ll need to choose the features. I broke out class by gender so that our features are child, first class male, first class female, second class male, etc.
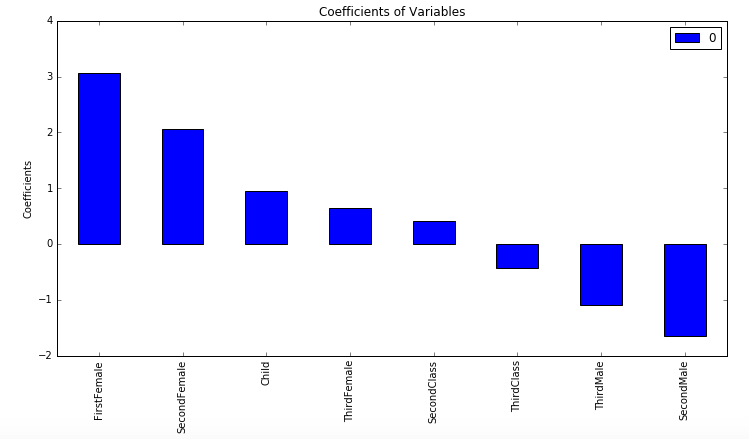
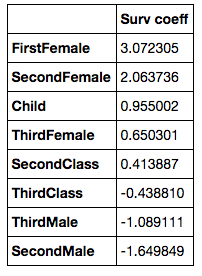
The coefficients of the regression are listed below, and you can see the likelihood of survival increases with class and decreases for males over females.
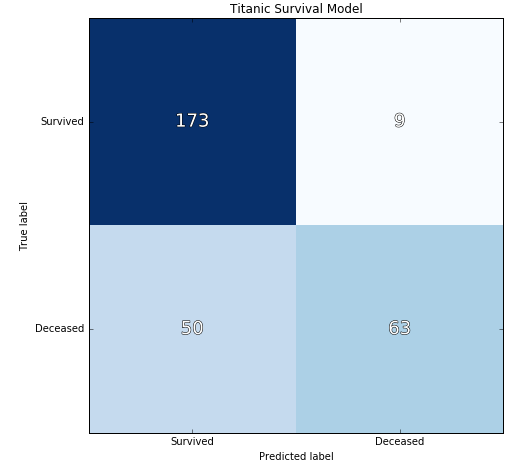
The cross val score for this model is 0.7896, and the confusion matrix is below:
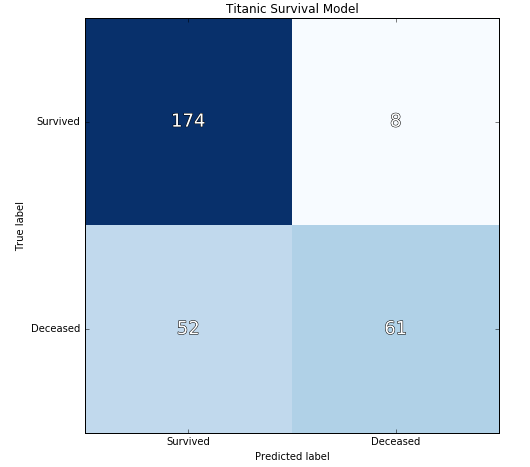
The confusion matrix tells us that the model is very accurately predicting survivors (precision score = 88%) but is also predicting many as survived that actually were deceased (recall score = 54%). In other words, we’re predicting almost all survivors accurately at the expense of also predicting almost half of the deceased as also survivors.
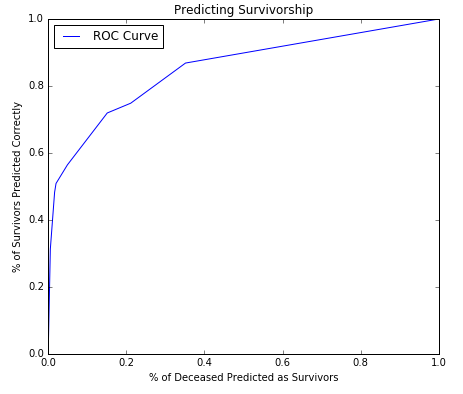
The ROC curve for this model looks like this:
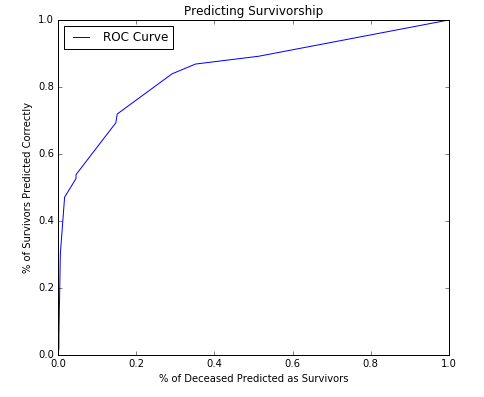
The ROC curve is the relationship between False positives and True Positives. As the model accuracy improves by accuraretely prediciting more true positives, the false positives also increase. This ROC curve shows a very strong model.
We then run Gridsearch with logistic regression to find the best parameters, and they are as follows:

We can also compare Gridsearch with kNN to see how these best parameters compare, and we see that the score is slightly higher with kNN.:

We can then rerun our model with these paramaters and compare the confusion matrix and ROC curve.
The accuracy of this model is just slightly higher with a score of 0.8000 as compared to 0.7966 with the first model.